When was Money Raised and Spent?
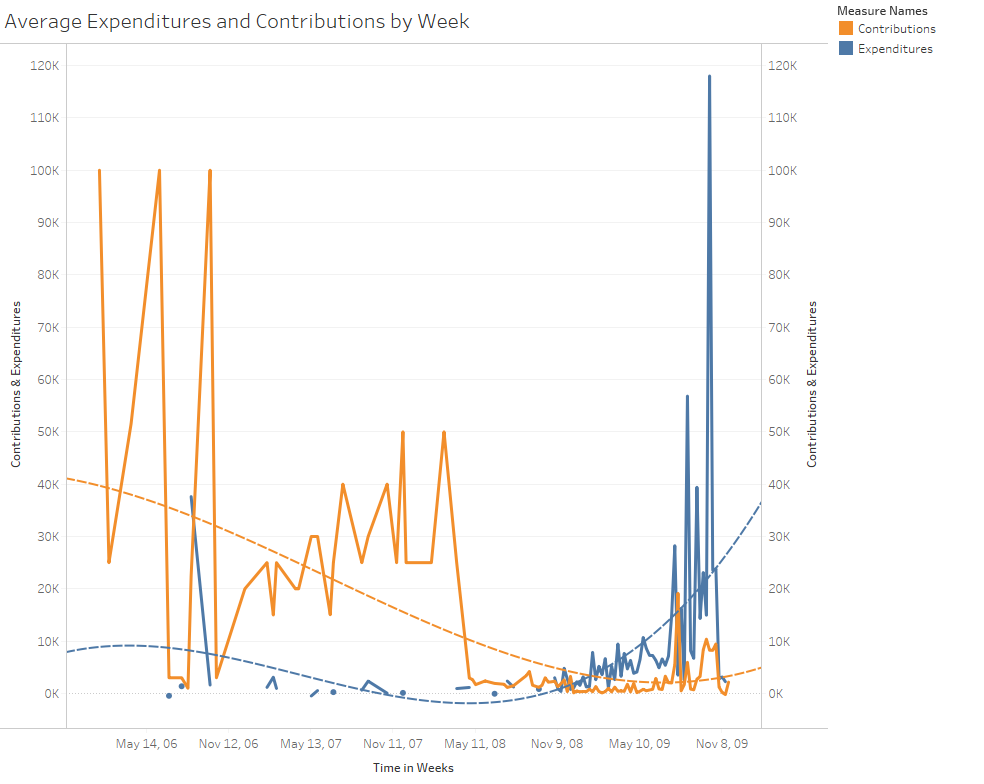
A Line Graph of Money Raised vs. Money Spent Over Time
There seems to be an inverse relationship between when money is raised and when money is spent. Early in the campaign, as early as 2006, candidates and their campaign organizations are raising money. While many of the spikes are Jon Corzine giving money to his own campaign, there is still a significant amount of activity in 2007, two years before the 2009 election. As the November election day draws nearer and nearer, campaign organizations start to spend more and more money to capture voters who are now just thinking about the election. In November, candidates are spending significant amounts of money in hopes of getting the last few remaining voters necessary to win. While the data does include the primary elections from June 2009, New Jersey gubernatorial primaries tend to be very low turnout elections. Candidates are likely saving their money for the more competitive general election in November. Since they are such low turnout elections, the voters themselves are unlikely to give a candidate money to win an election they themselves are do not planning on voting in. It is also interesting that the graph is not very smooth, some weeks far more money was raised or spent than in other weeks even with the two weeks happened one right after the other.
Return Home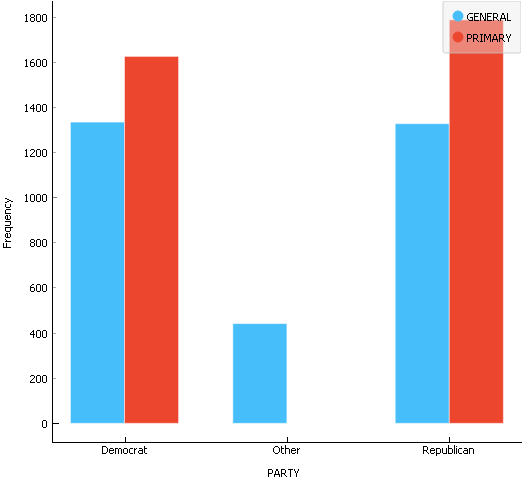
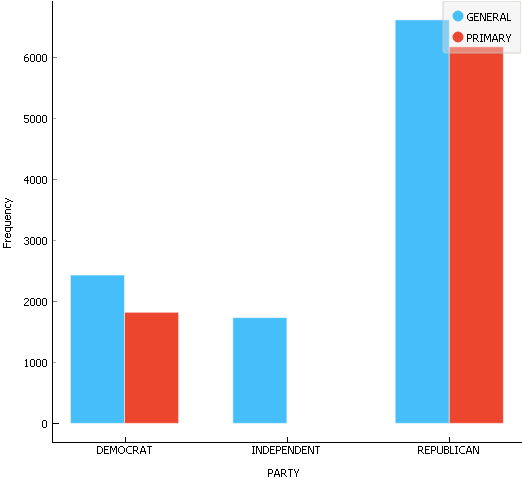
Two Bar Charts Showing Frequency of Spending & Donations
Interesting, the data shown in the two Frequency graphs is totally opposite to the data visualized in the Average Expenditures and Contributions by Week graph. While seemingly contradictory, this may have a good reason simply based around what the two sets of graphs measure. The Average Expenditures and Contributions by Week only measures the value of a donation or an expense; a larger donation or expense is shown more strongly than several small donations or expenses. Jon Corzine's large donations before the primary are shown far stronger than any donations made later in the election cycle. But, the Frequency of Contributions graph treats Corzine's large donations as equal in weight to any other contribution made in the primary election since it measures how many contributions come in, not how valuable those contributions were. The same can be said for the Frequency of Spending graph. Campaigns need to set up the campaign organization early in the primary season, resulting in a large number of primary expenditures. In the general election the campaigns have the organization but need to convince the less interested voters to vote for them, nessating a few high value expenditures in things like TV commercials to attract these voters or expensive surveys to understand the voters as a whole.
The graphs also show that while Republican and Democratic candidates spent money about as frequently, Republicans got far more donations than Democrats. This could be one way Republican Chris Christie was able to overcome incumbent Democrat Jon Corzine's large donations.
Return Home